The developer always used Google chrome
In this post, I will share some cool tips about
For simple logging in
If you want to change the colour of

$ads={1}
You can use
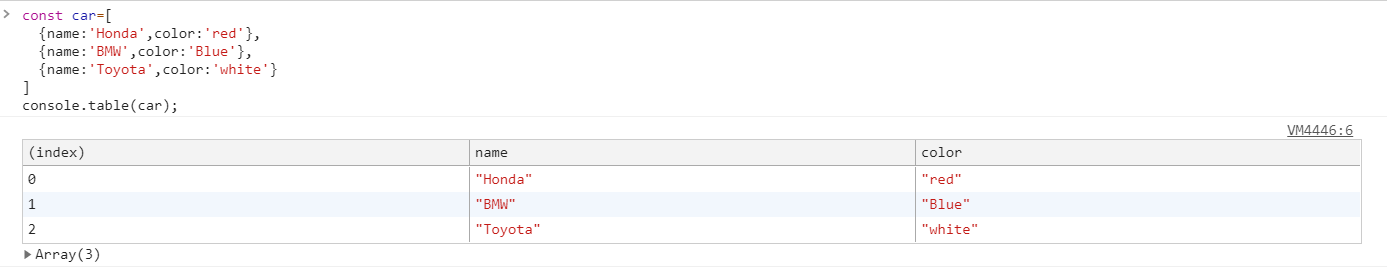
For example, let suppose you have the following object in your code and you want to print in table
If you want to print the trace of function execution you can use

Write to the console the number of time the console. count() is called inside the loop:
[IMAGE]
Let’s suppose you want to profile any function in javascript and want to check the execution time then you can use

console.log features for debugging their code.In this post, I will share some cool tips about
console APIconsole.log
For simple logging in Google Chrome console we write console.log(msg)
console.log
If you want to change the colour of console.log message in Developer console you can pass console colour as below console.log('%c%s',"color:red;font-size:16px","Hello world")

console.table
$ads={1}
You can use console.table to print the object in tabular form.For example, let suppose you have the following object in your code and you want to print in table
const car = [
    { name: 'Honda', color: 'red' },
    { name: 'BMW', color: 'blue' },
    { name: 'Toyota', color: 'white' }
  ];

console.trace
If you want to print the trace of function execution you can use console.trace to print the execution of your functionfunction fact(number) {
if (number < 1) {
return 1;
}
else {
console.trace(`calling fact(${number})`)
return number * this.fact(number - 1);
}
}

Console.count
Write to the console the number of time the console. count() is called inside the loop:[IMAGE]
console.time and console.timeEnd
Let’s suppose you want to profile any function in javascript and want to check the execution time then you can use console.time and console.timeEnd function. Just wrap your function in between console.time and console.timeEnd as shown belowfunction fact(n){
if(n){
return 1;
}else{
return n*fact(n-1);
}
}
console.time('fact');
fact(40);
console.timeEnd(`fact`);
